
Vanity Metrics: What They Are, Dangers They Pose, How to Identify and Replace Them With Actionable Metrics
When Claudia Gray said, “Math doesn’t lie,” in her novel A Million Worlds with You, it’s probably because she had never seen a digital marketing dashboard in her life. In reality, vanity metrics actively misguide business decisions, derail marketing strategies, and waste precious resources. Technically though, the math itself isn’t lying; it’s just marketers and business leaders deluding themselves with misleading (although factual) analytics data. And that can be dangerous!
Data-driven decisions must be based on metrics that truly reflect your business performance and offer guidance on the next steps, aka actionable metrics. In this guide, you’ll learn everything you need to know about them.
Key Takeaways:
- How and why vanity metrics distort business reality?
- The dangers of basing business decisions on vanity metrics
- How to identify vanity metrics in different business contexts?
- How to replace vanity metrics with actionable metrics?

What are Vanity Metrics?
In his seminal book, The Lean Startup, Eric Ries explains that vanity metrics are feel-good data points that look impressive on paper and make a project team or a business leader feel successful, but lack substance, operational context, or a direct link to actual business goals. They offer little to no insight into what’s influencing performance or what the teams should do next.
Telltale Signs of Vanity Metrics:
- Unidirectional Cumulative Totals: Running totals that can never decrease (e.g., “total account registrations” or “lifetime site visitors”).
- Contextual Isolation: Numbers presented without comparative timeframes, cohort percentages, or ratio benchmarks.
- No Decision Causality: The metric fails the basic operational question: “If this number swings by +/-20% tomorrow, what specific business action do we take?”
- Susceptibility to Inflation: Numbers that can be artificially boosted via low-quality ad spend, viral giveaways, or bot traffic without improving net profit.
What are Actionable Metrics?
An actionable metric is a data point that directly links a business action to a clear, measurable outcome.
Unlike vanity metrics, which flatter reporting dashboards without guiding strategy, actionable metrics show clear cause-and-effect relationships, allowing teams to make informed decisions, pull operational levers, and drive bottom-line growth.
Salient Features of Actionable Metrics:
- Decision Causality: It answers the basic question: “If this number swings by +/-25% tomorrow, what specific operational or financial action do we take?”
- Repeatability & Control: It tracks deliberate, repeatable customer behaviors or technical processes that your team can directly influence or optimize.
- Contextual Clarity: It is expressed as a rate, ratio, percentage, or cohort trend rather than an isolated aggregate integer or running total.
- Inflation Resistance: It cannot be artificially inflated through cheap ad spend, giveaways, or bot traffic without reflecting actual changes in unit economics or margin.
Vanity Metrics vs Actionable Metrics: Dangers of Ego-boosting Data Points
The vast majority of analytical tools are preconfigured by default to report on vanity metrics. After all, they are the easiest to measure, familiar to most users, and offer them instant gratification by feeding into their false sense of progress!
Here’s how relying on vanity data creates four distinct organizational risks:
- Resource and Capital Misallocation: Marketing teams frequently pour ad budget into high-impression, low-intent channels that generate massive top-of-funnel traffic but yield negligible bottom-of-funnel conversions.
- Hidden Customer Churn: Product teams celebrating a total user base milestone often miss the reality that 90% or more of those users became permanently inactive within days of registration.
- Deceptive Incentive Alignment: When internal Key Performance Indicators (KPIs) reward vanity volume (e.g., publishing 50 blog posts or acquiring 100,000 video views), employees optimize for activity output rather than net revenue outcome.
- False Strategic Validation: Teams interpret surface growth curves as validation of product-market fit, delaying crucial product pivots or onboarding fixes until cash reserves are depleted.
An actionable metric, by contrast, provides clear, auditable guidance. It answers a fundamental question: “If this number changes by 20%, what operational, technical, or financial decision must we execute?” If a data point cannot directly inform a business decision, it functions purely as noise.
In light of these concerns, it’s hardly surprising that HubSpot State of Marketing Report, 2026 found that the top 5 metrics that matter to marketers in 2026 are all actionable: Lead quality and MQLs (39%), Lead to customer conversion rate (34%), ROI (31%), Customer acquisition cost (30%), and lead generation volume (29%).
Common Vanity Metrics vs Replacement Actionable Metrics
Whether a metric functions as a vanity indicator depends on business model structure, operational maturity, and reporting context. A data point that acts as a vanity metric for a B2B enterprise SaaS platform (raw website sessions, for instance) may serve as a core operational metric for an ad-supported digital news publisher.
To build an actionable telemetry architecture, digital organizations must systematically swap out superficial indicators for actionable replacements across their core operational domains. Here are some examples:
| Industry | Vanity Metric | The Hidden Problem | Actionable Metric | When to Take Action |
|---|---|---|---|---|
| 01 SaaS & Tech | Total Signups; Downloads | Hides how many users quickly abandon or delete the app. |
Daily Active Users & 30-Day Retention | Fix user onboarding if retention drops below target after 30 days. |
| 02 SEO & Search | Average Keyword Rank; Domain Score | High ranks don’t help if users get answers without clicking (zero-click searches). |
Real Search Share of Voice & Organic Leads/Sales | Stop spending on keywords buried under AI summaries and ad blocks. |
| 03 Paid Ads & Social | Total Followers; Total Likes; Impressions | Passive exposure that shows no real interest or buying intent. |
Click-Through Rate (CTR) & True Cost per Customer (CAC) | Shift ad budget away from high-view posts that fail to get clicks. |
| 04 E-Commerce | Total Store Visits; Raw Orders | Ignores abandoned carts, product returns, and order cancellations. |
Repeat Purchase Rate, Customer Lifetime Value (LTV), & Return Rates | Audit checkout friction if customer repeat purchases slow down. |
SaaS and Tech
In SaaS analytics, celebrating cumulative registered users masks critical retention failures. Industry data reveals that 46.1% of new users uninstall apps within 30 days of downloading them. But does that reflect in the “Total Downloads” metric? No!
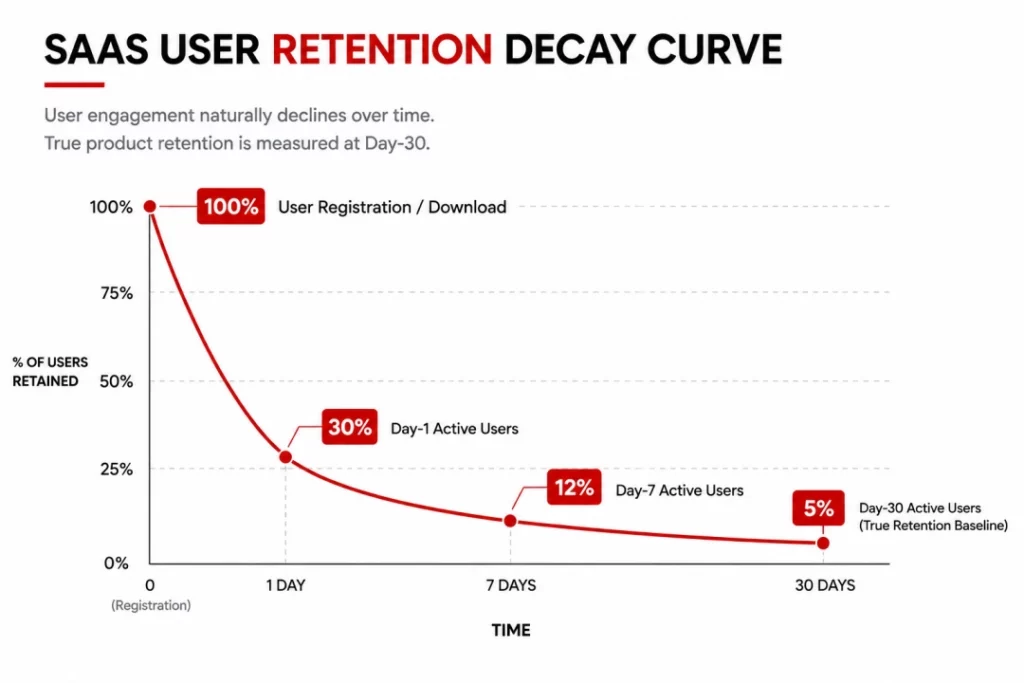
Relying on gross registration totals creates a false impression of growth. Product teams must replace cumulative metrics with the Daily Active Users to Monthly Active Users ratio (DAU/MAU) combined with Day-30 cohort retention curves. Tracking the precise percentage of a specific user cohort that continues to complete core value actions over a 30-day window isolates onboarding friction and guides product sprint priorities.
Search Engine Optimization (SEO)
When you have a content-driven inbound marketing strategy in place, it’s easy to get sidetracked by vanity metrics like impressions, organic traffic, social shares, etc. However, the impact of your efforts should be measured only via metrics that truly matter to you like leads generated per landing page, cost per lead, organic pipeline value, and so on.
Reporting flat average keyword rankings or third-party authority scores like Domain Authority or Domain Rating is deeply misleading. Third-party authority metrics do not exist within Google’s actual ranking algorithms and can be easily manipulated through low-quality link building.
Furthermore, traditional rank tracking fails to account for modern SERP layouts. A domain holding a theoretical position #2 ranking for a commercial query can experience a severe decline in traffic if Google AI Overviews, sponsored ad clusters, and local map packs occupy the top 1200 vertical pixels of the display screen. Search strategists must transition toward calculating pixel-adjusted Share of Voice (SoV) across intent-mapped topic clusters, identifying competitive search intent, and connecting visibility directly to downstream conversion yield.
Performance Marketing and Social Media
Social media platform interfaces are deliberately engineered to highlight surface engagement metrics, such as likes, retweets, and view counts, because these numbers provide instant psychological validation. However, high social engagement rarely exhibits a linear correlation with commercial revenue.
A viral video generating 500,000 impressions produces zero business value if the audience consists of low-intent users outside your target market. Consider this example of a viral video that generated several million views but failed to generate a single sale!
Social media strategies must align with business goals, and not become an ego-boosting exercise. In fact, social media-driven brand growth doesn’t necessarily require large budgets. They need marketers to focus on the right metrics.
For instance, one of our clients already had substantial organic and referral traffic. But, what really moved the needle for them is when we boosted their qualified practice demo bookings by 420%, while slashing cost per qualified lead by 58%.
Performance marketing teams must evaluate campaigns using outbound click-through rates, profile-to-site conversion ratios, and fully loaded Customer Acquisition Cost (CAC) broken down by acquisition channel.
E-Commerce and Retail
In digital retail, tracking gross store visits or raw transaction counts without adjusting for operational realities leads to margin erosion. High gross order volumes can be offset by high shopping cart abandonment rates, product return rates, and Return-to-Origin (RTO) logistics failures.
For instance, Wayfair posted net revenues of $12.5 billion for the financial year 2025, a good 5.1% bump year-on-year. However, these vanity metrics hide a fact that really matters – when all their costs were accounted for, Wayfair had registered a net loss of $313 million!
Since entering India in 2013, Amazon India has amassed over 150 million active users. Yet, the e-commerce giant hasn’t posted profits for even a single year over this period in the market!
Optimizing conversion funnels to fix checkout abandonment and reduce the high cost of returns necessitates a strong focus on actionable metrics. E-commerce analytics must focus on Net Repeat Purchase Rates, Net Customer Lifetime Value (LTV), and fulfillment success rates to ensure top-line volume translates into actual net profitability.
Real-World Case Study:
High-ticket e-commerce brands often suffer when vanity ad spend drives broad clicks rather than commercial buyers. See how MagicDart replaced consumer “Add to Cart” buttons with intent-driven quote funnels to increase qualified B2B leads by 500% and cut acquisition cost by 62%.
When Vanity Metrics Act as Leading Indicators and Become Actionable Metrics
Despite the criticisms leveled against vanity metrics, analytical rigor requires recognizing an essential caveat: a metric traditionally dismissed as “vanity” can function as a highly actionable leading indicator if it maintains a statistically proven correlation with a downstream lagging result.
In agile framework development, analysts distinguish between leading and lagging indicators:
- Lagging Indicators: Confirm that an outcome has occurred (e.g., quarterly net revenue, annual customer churn rate, or post-release defect rates). They are exact, auditable, and definitive, but they arrive too late to inform real-time operational course corrections.
- Leading Indicators: Measure intermediate behaviors or inputs that occur in advance of the lagging outcome (e.g., daily active user interactions, trial feature configurations, or unique site traffic).
Consider unique website visitors. Evaluated in isolation without contextual segmentation, raw visitor volume is a classic vanity metric. A spike in unique visitors tells a team nothing about user intent, profitability, or engagement.
However, if an enterprise SaaS firm’s historical data confirms a stable, uncorrupted 3.2% conversion rate from unique organic visitors to qualified sales demos, and a 25% rate from demos to verified revenue, then unique organic visitor volume operates as a vital leading indicator for future sales pipeline capacity.
The Leading Indicator Conversion Pathway
In the above example, the metric degenerates back into a vanity trap the moment operational teams optimize for the leading signal directly without preserving cause-and-effect integrity. If a marketing team, evaluated strictly on unique visitor volume, purchases low-quality pop-under traffic or clickbait ads to inflate visitor numbers artificially, the historically established 3.2% conversion rate collapses. The metric becomes corrupted.
As long as operational governance preserves the cause-and-effect link between the input and the business outcome, tracking leading indicators provides necessary operational velocity.
When Actionable Metrics Degrade Into Vanity Metrics
The above instance of an actionable leading indicator degrading into a vanity metric under certain conditions isn’t an isolated case. In fact, a much-coveted actionable metric recently devolved into a vanity metric with the change in broader context. That metric is “keyword rankings.”
For two decades, search engine optimization relied on a simple premise: rank on page one for high-volume keywords, capture organic clicks, and convert that traffic into business revenue. In the modern AI search era, this model has collapsed, transforming traditional keyword rankings into vanity metrics.
Visual SERP Displacement vs. Organic Rank #1
The devaluation of flat keyword rankings is driven by three structural shifts in search engine architecture:
Shift 1: The Zero-Click Search Dominance
According to SparkToro, over 68% of all Google searches now end without a click to an external web property. Search Engine Results Pages (SERPs) have evolved from gateways directing users to external websites into direct answer engines. Features such as Featured Snippets, Knowledge Panels, unit converters, and “People Also Ask” (PAA) accordions satisfy user intent directly on the SERP. As a result, holding position #1 for an informational query frequently yields high search impressions but zero website traffic.
Shift 2: Pixel Depth Displacement

Google displays an average of 12+ SERP features per search query. Sponsored shopping grids, local map packs, video carousels, and generative AI answer blocks occupy prime visual screen real estate. A domain holding an unadjusted “Rank #1” organic position may be physically located 1,500 vertical pixels down the screen, forcing mobile and desktop users to scroll past multiple screens before encountering the first organic link.
Shift 3: Generative AI Overviews and SearchGPT Interception
The deployment of Google AI Overviews and conversational AI answer engines (such as SearchGPT and Perplexity) synthesizes information from multiple web pages into a single inline summary. Rather than clicking through to three separate organic links, searchers read the synthesized answer and move on. Reporting a flat rank position without measuring AI Overview citation inclusion or pixel visibility creates a fundamental reporting blind spot. To evaluate organic search performance accurately, analytics teams must abandon flat rank tracking and adopt Pixel-Adjusted Share of Voice (SoV) across full topic clusters.
Transitioning From Vanity Metrics to Actionable Metrics: The 5-Step Roadmap
Transitioning an organization away from vanity reporting requires systematic execution. Use this 5-step operational roadmap to audit your dashboards, realign team KPIs, and deploy actionable telemetry.
- Step 1: Clean Up Your Dashboards: Delete every chart or stat that doesn’t actually help you make a business decision. If seeing a number won’t change your actions, remove it.
- Step 2: Always Pair Numbers With Context: Never look at big, raw numbers by themselves (like “10,000 total visitors”). Always pair them with a rate that shows quality or retention (like “10,000 visitors with a 5% purchase rate”).
- Step 3: Set “If This, Then That” Rules: Decide in advance what action you will take when a number goes up or down. If a metric changes, everyone should automatically know what operational move to make.
- Step 4: Track Groups of People Over Time: Stop looking at vanity running totals. Track specific customer groups (cohorts) over 30, 60, or 90 days to see if people are actually sticking around and staying loyal.
- Step 5: Reward What Actually Makes Money: Stop giving teams bonuses for getting “likes,” “clicks,” or raw signups. Tie team rewards and goals directly to profit, retention, and revenue-driven digital marketing services.
Key Takeaways Summarized
Here’s a recap of everything we just covered:
- Vanity Metrics Distort Reality: Surface-level indicators like pageviews, followers, and raw sign-ups look impressive on paper but lack business context and misguide strategic decision-making.
- Actionable Metrics Drive Growth: High-value data points establish direct cause-and-effect relationships with business goals, providing repeatable insights that trigger concrete operational actions.
- The Danger of Ego-Driven Data: Relying on vanity numbers leads to wasted budgets, masks hidden customer churn, creates deceptive employee incentives, and falsely validates product-market fit.
- Context Dictates Metric Value: A vanity metric can serve as an effective leading indicator if it reliably correlates with downstream revenue, but tracking must maintain cause-and-effect integrity.
- Systematic Dashboard Migration: Transitioning to actionable reporting requires purging unhelpful data, pairing raw totals with conversion rates, tracking customer cohorts over time, and aligning KPIs with revenue.

Leave a Reply