
The Ultimate Playbook for Conversion Rate Optimisation in India: Tailoring Digital Funnels for High-Growth Indian Businesses
Conversion Rate Optimisation (CRO) brings more customers to businesses without increasing their ad budget. It is now more relevant than ever because D2C brands in Mumbai, B2B businesses in Delhi, SaaS startups in Bangalore, digital agencies in Gurgaon, and other businesses across industries are reporting a whopping 60% average bump in customer acquisition costs (CAC). This is when Indian businesses convert only 1% – 2% of their visitors on average. Naturally, interest in Conversion Rate Optimisation (CRO) has witnessed a steep rise in 2026.
AI overviews, zero-click searches, and answer engines have together marked the end of cheap traffic from search engines. Indian businesses are now forced to pivot towards paid media channels like Google Ads, Meta Ads, LinkedIn Ads, and so on, adding to the competition for the same limited ad spaces, ultimately driving the prices for ad placements. Conversion Rate Optimisation (CRO) is the systematic process of increasing the percentage of digital visitors who complete a desired action, turning casual browsers into verified leads, active inquiries, or paying customers.
In this comprehensive, data-dense playbook, we explore the mechanical, technical, and psychological strategies required to build high-converting digital funnels in India. We analyse the role of domestic internet infrastructural performance, the unique payment habits of local shoppers, and the exact testing steps needed to make the most money from your website.
Conversion Rate Optimisation in the Indian Market
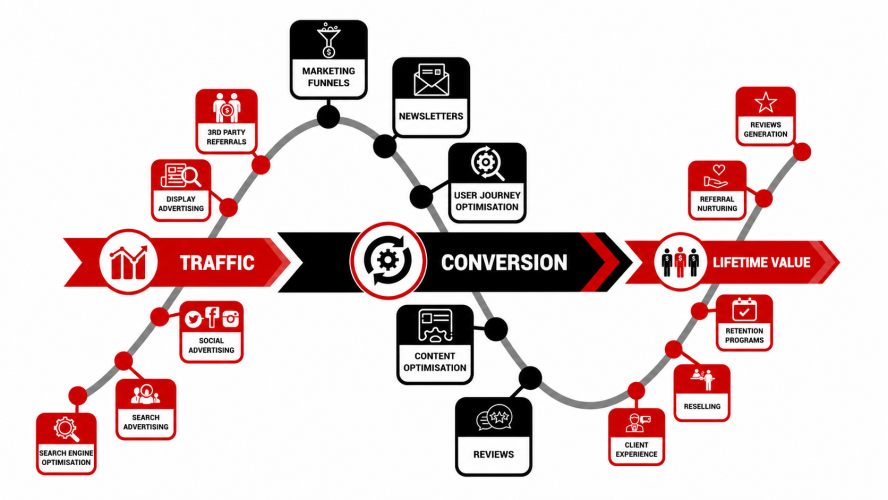
Conversion Rate Optimisation is a multi-dimensional approach that combines consumer psychology, online shopping habits, domestic infrastructure limits, email marketing, content marketing, on-page SEO, and technical SEO to create high-conversion funnels. Too often, marketers treat CRO as a series of cosmetic website redesigns or subjective visual changes for their own detriment, but they’re barely scratching the surface.
What is Conversion Rate?
Conversion rate denotes the percentage of visitors who complete a desired action, whether it’s a purchase, account signup, contact form submission, newsletter signup, or some other valuable action.
For Example:
- Your website receives 10,000 visitors in one month.
- 200 visitors submit an enquiry form.
Your conversion rate is: 200 ÷ 10,000 × 100 = 2%.
A 2% conversion rate might seem disappointing, but it’s actually the average for Indian businesses. That means there’s a huge potential for growth. In fact, let me paint you a picture of what conversion rate optimisation can do for your business:
| Monthly Website Traffic | Conversion Rate | Leads Generated | Lead Growth |
|---|---|---|---|
10,000 | 2% | 200 | Baseline |
10,000 | 3% | 300 | +50% |
10,000 | 4% | 400 | +100% |
10,000 | 5% | 500 | +150% |
Without ever increasing your advertising budget or traffic, you can generate 50% more leads merely by increasing your conversion rate from 2% to 3%. An effective CRO strategy can help you push that number even higher!
Suppose your business spends ₹90,000 on digital marketing to acquire 200 leads per month. If your conversion rate increases from 2% to 4%, you can generate 400 leads with the same ₹90,000 budget.
For businesses investing heavily in SEO, content marketing, or paid advertising, these gains often translate into substantial revenue growth or cost reduction over time.
A mature conversion rate optimisation strategy tracks two distinct categories of user actions to gain a clear view of funnel health:
1. Macro-Conversions
These represent direct financial or business outcomes, such as a completed e-commerce transaction, a paid subscription activation, or a high-value qualified lead submission.
2. Micro-Conversions
These represent incremental user engagement actions that signal commercial intent, such as adding an item to a cart, downloading a product brochure, interacting with an interactive product tour, or starting a WhatsApp chat. Tracking micro-conversions is critical for identifying where friction points exist in the user journey.
Remember, a good conversion rate for your industry may not be so for another. To measure the effectiveness of your platforms, your CRO efforts must be analysed against realistic, contextual benchmarks. Here are typical conversion rates for different Indian industries:
| Industry / Category | Typical Conversion Rate | What Drives the Variation? |
|---|---|---|
👕 Apparel & Fashion | 1.2% – 2.5% | Brand recognition plays a major role. Established brands like Snitch and The Souled Store typically convert significantly better than newer entrants. |
🧴 Personal Care & Skincare | 1.5% – 2.8% | Trust is the biggest differentiator. Well-known brands such as Minimalist, Auli, and CosIQ often achieve conversion rates near the upper end. |
💊 Health Supplements | 1.0% – 2.0% | Strong trust barrier. Clinical validation, doctor recommendations, certifications, and authentic reviews significantly improve conversions. |
⌚ Electronics & Wearables | 0.8% – 1.5% | Longer buying journeys are common. Customers frequently compare alternatives across multiple sessions before purchasing. |
🥫 Food & FMCG D2C | 2.0% – 4.0% | Repeat purchases, lower perceived risk, and subscription models contribute to higher-than-average conversion rates. |
🎓 EdTech | 0.5% – 1.5% | Education purchases require substantial trust and research, making this one of the most difficult categories to convert. |
☁️ SaaS Trial Sign-up | 3% – 8% | Highly dependent on traffic quality and product experience. Free plans and product-led growth strategies often produce the highest conversion rates. |
Source: India Ecommerce Conversion Rate Benchmarks 2026
These numbers tell a tale that’s in stark contrast to high-trust markets like the US, where the average conversion rate almost never drops below 2% for any industry.
Why CRO Matters More Than Ever in India?
The Indian digital landscape has always been a complex challenge for businesses to navigate. Besides the universal principles of conversion optimisation applicable worldwide, Indian businesses must tackle a confounding mix of the technical, behavioural, and regulatory challenges unique to the domestic context.
These are some of the challenges that make conversion rate optimisation all the more relevant and urgent for Indian businesses:
Low Initial Trust and Scepticism
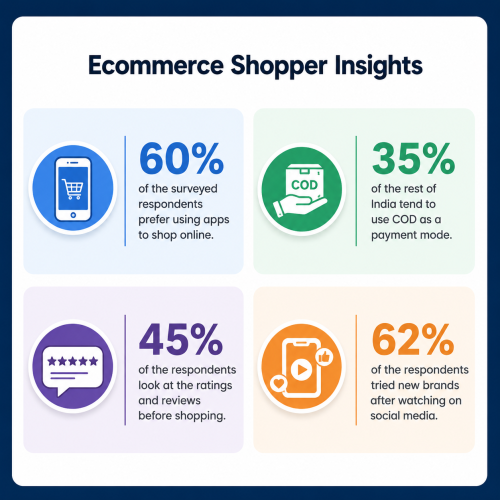
Indian consumers are less trusting of online transactions compared to their US counterparts on average, at least at the beginning. They require explicit validation of product quality, clear customer service access, visible regulatory compliance (such as RBI credentials), and prominent guarantees on returns, refunds, exchanges, and cash-on-delivery (COD) policies before committing to a purchase.
High Price and Value Sensitivity
Indian shoppers are highly value-conscious. This requires value propositions, active discount codes, and bundled savings options to be displayed prominently near calls-to-action. All of this increases cost of acquisition.
Conversational over Form-Based Communication
Western B2B and lead-generation sites rely heavily on multi-field email forms. In India, forms often create friction. Incorporating conversational tools, such as direct WhatsApp lead capture and real-time chat, aligns with the conversational shopping preferences of desi shoppers. Omnichannel experiences that integrate Email Marketing, WhatsApp Marketing, and SMS Marketing are significantly more effective than siloed campaigns.
Payment Method Divergence
While credit cards and standard digital wallets dominate Western checkouts, the Indian transactional landscape is defined by the Unified Payments Interface (UPI) and Cash on Delivery (COD). Ignoring these domestic payment patterns is a primary driver of cart abandonment.
I’ve covered an extensive list of conversion rate optimisation (CRO) techniques that’ll work for every type of business in India in a separate post, since it’s beyond the scope of this high-level guide.
Today, however, I will get you started with a clear blueprint for implementing CRO and best practices that work. This blueprint will cover technical tips, cognitive insights, and inbound marketing tactics.
Conversion Rate Optimisation: Technical Improvements (Core Web Vitals)
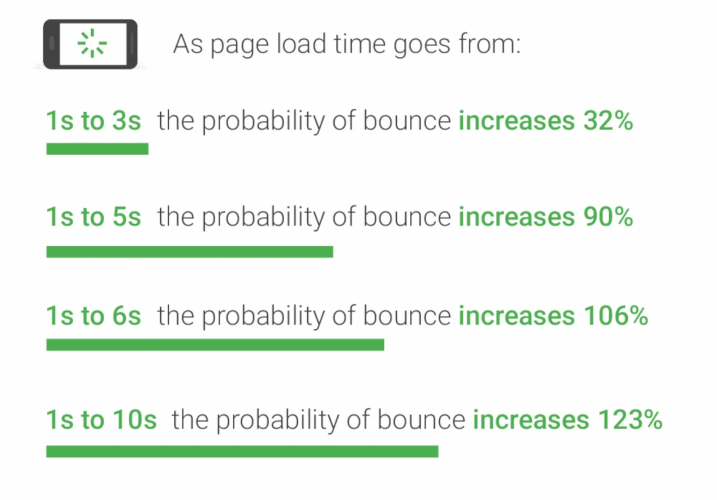
No amount of persuasive copy, high-resolution product imagery, or hard sales tactics can salvage the conversion rate of a slow-loading web page. Page speed is a core website performance metric and the foundation of digital user experience. Research consistently shows that slow-loading sites increase bounce rate and directly reduce revenue.
A web page that loads within 1 second has a 3x higher conversion rate than a page that loads in 5 seconds. Furthermore, a 2-second delay in webpage loads causes a 4% revenue loss.
With customer acquisition costs soaring, wouldn’t it be a windfall for your business if you could move the needle on that conversion rate merely by making your website faster?
That’s precisely what infrastructure optimisation is all about.
The Regional Latency Gap
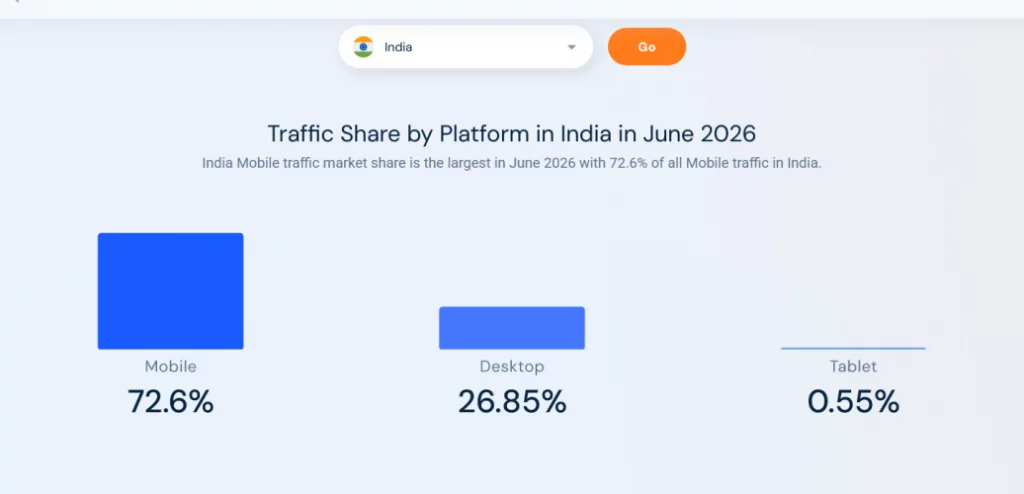
While metropolitan hubs like Mumbai, Bengaluru, and Delhi benefit from widespread 5G mobile networks, the quality of network infrastructure varies widely across Tier-2 and Tier-3 Indian cities. A landing page that loads within 1 second in a Bandra-Kurla Complex office on high-speed broadband can take 10-30 seconds or longer when accessed on low-coverage 3G or 4G mobile connections in a smaller city. To achieve higher conversions across all geographic regions, landing page optimisation programs must focus on minimising page weight and optimising code.
To achieve this, digital platforms must address the Core Web Vitals framework:
Largest Contentful Paint (LCP): This measures how quickly the primary, meaningful content of a page loads for the user. Senders should target an LCP of under 2.5 seconds.
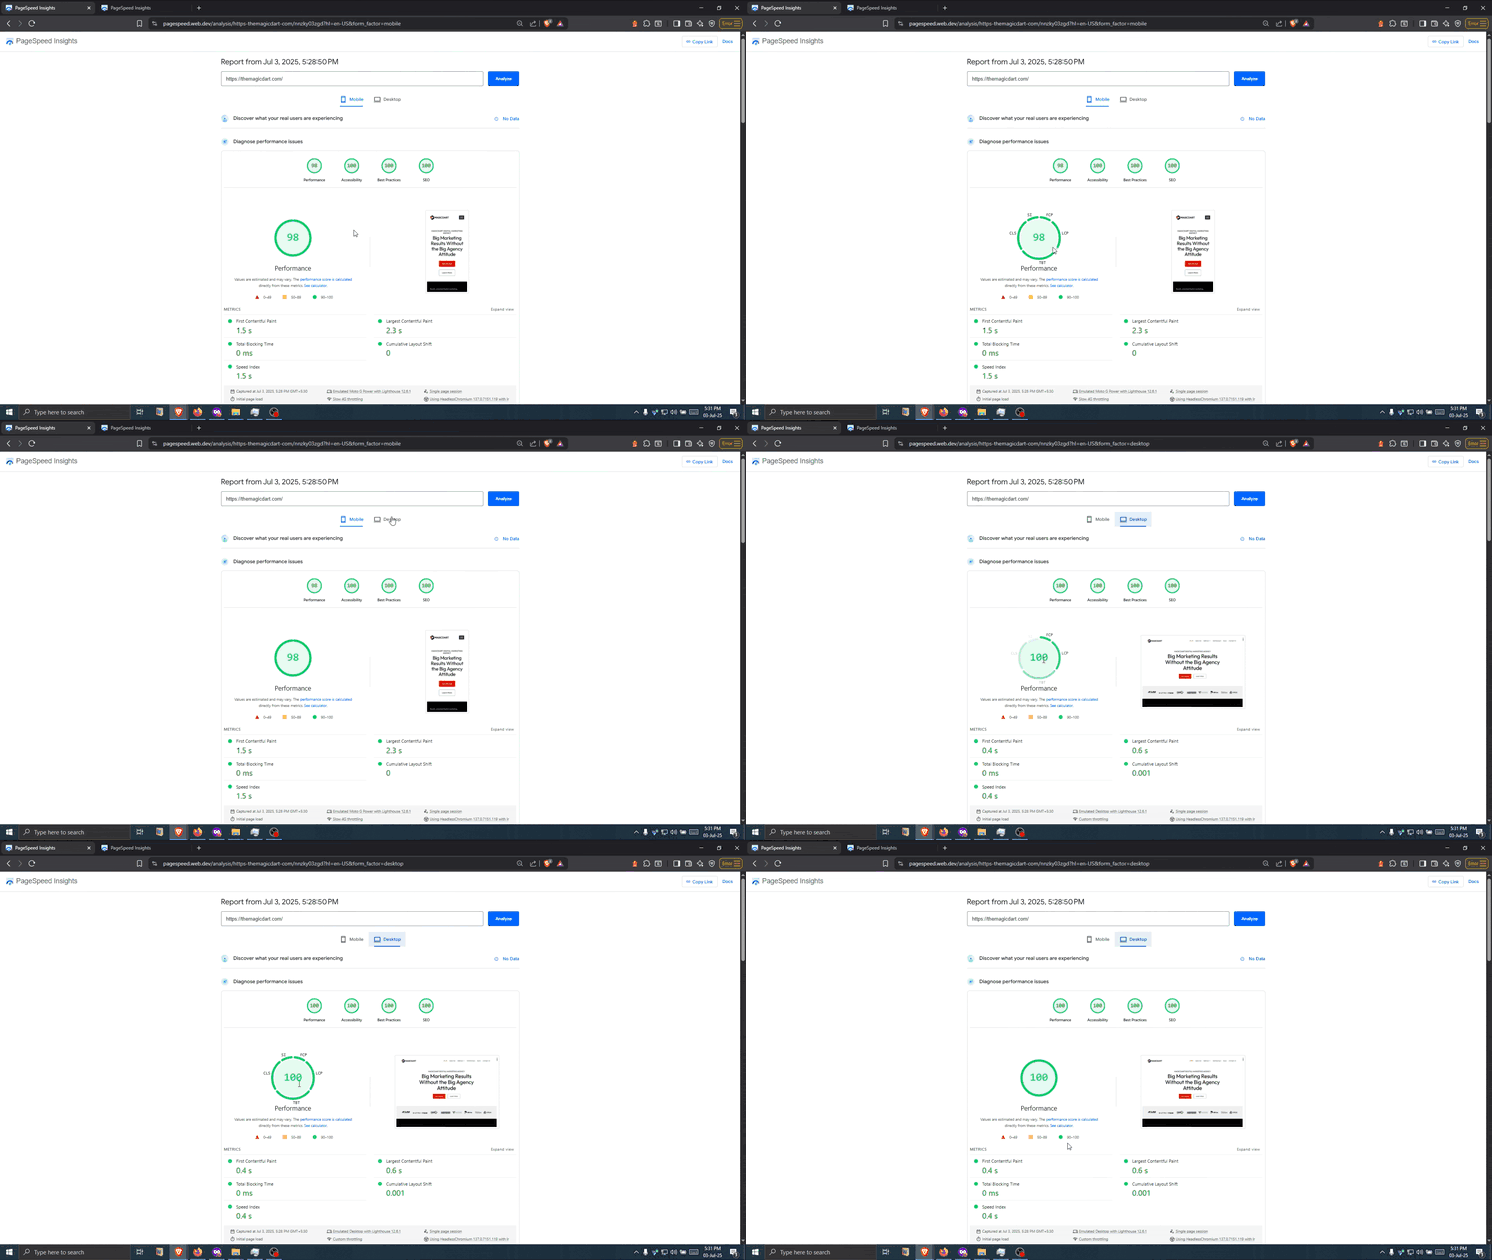
Cumulative Layout Shift (CLS): This measures the visual stability of a page to prevent unexpected layout movements while the content is rendering. Senders should target a CLS score of under 0.1.
Time to Interactive (TTI): This measures how quickly a page becomes fully responsive to user inputs (such as clicks, taps, or keystrokes), with a target of under 3.9 seconds.
First Contentful Paint (FCP): This measures the time it takes for the browser to render the first piece of DOM content, with a target of under 1.8 seconds.
Initial Server Response Time (TTFB): Senders should target a time of under 200 milliseconds to establish immediate server communication.
Technical Optimisation Steps
Performance marketing, growth marketing, and engineering teams should implement the following optimisations to meet the technical standards discussed above:
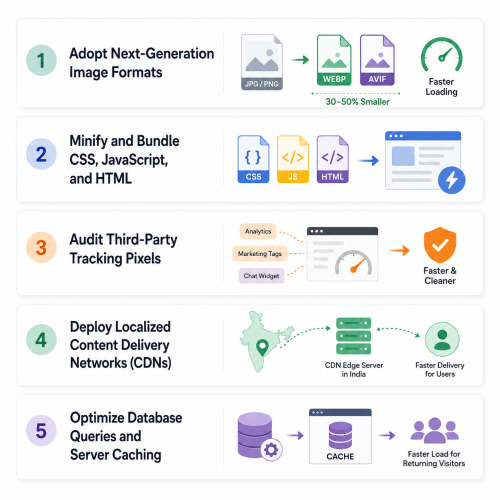
1. Adopt Next-Generation Image Formats
Traditional JPEGs and PNGs often create excessive page weight. All product images, hero creatives, and visual banners must be compressed and served in WebP or AVIF formats. WebP files are typically 30% to 50% smaller than JPEGs, directly reducing mobile load times. Additionally, implement image lazy loading so assets below the fold only render as the user scrolls.
2. Minify and Bundle CSS, JavaScript, and HTML
Clean up backend code by removing unnecessary characters, spaces, comments, and unused scripts. Ensure that CSS is delivered inline for critical rendering paths, and defer non-essential JavaScript execution to prevent render-blocking bottlenecks.
3. Audit Third-Party Tracking Pixels
Excessive marketing tags, analytics scripts, and live chat widgets can slow down page responsiveness. Regularly audit tracking scripts using tools like Google PageSpeed Insights, and consolidate them through a centralised tag manager using asynchronous loading.
4. Deploy Localised Content Delivery Networks (CDNs)
Use CDNs (such as Cloudflare, Fastly, or AWS CloudFront) equipped with domestic edge servers in India to deliver static assets from locations closest to regional users.
5. Optimise Database Queries and Server Caching
Implement browser and server-side caching so returning visitors load cached versions of static assets, bypassing redundant database queries.
Conversion Rate Optimisation: Reducing Psychological Friction and Building Trust
Once a page meets technical performance standards, the focus of your CRO efforts shifts to managing cognitive load and psychological friction. Cognitive load represents the mental effort required for a user to process information and take action on a website. When landing page structures are disorganised, value propositions are unclear, or checkout processes are overly complex, users experience decision paralysis and abandon the funnel.
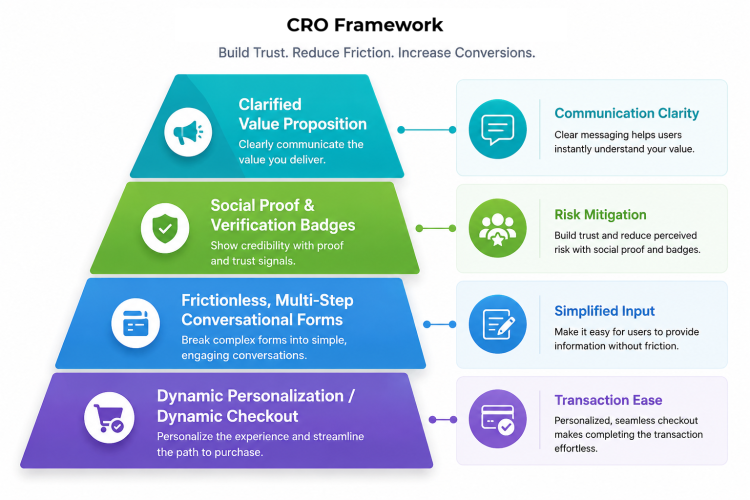
To optimise pages for trust and cognitive clarity, digital strategists apply five key design principles:
1. Value Proposition Clarity
The primary value proposition must be immediately obvious above the fold (the Hero section of the landing page), capturing user attention within a three-second window. Headlines should focus on outcome-based benefits, and avoid vague, jargon-heavy marketing copy. “Benefits; not features,” is copywriting 101, because nobody cares about your features. Your customers only care about what it means for them. Here’s an example:
- Ineffective (Jargon-Heavy): “We leverage synergistic machine learning methodologies to optimise enterprise-grade business processes and maximise operational intelligence.”
- Effective (Outcome-Focused): “Automate your SME business accounting in 10 minutes. Reduce tax filing errors by 40% with automated, real-time GST invoicing.”
2. Strategic Social Proof
Indian digital consumers require peer validation and proof of legitimacy before taking action. Social proof is most effective when positioned close to critical calls-to-action (CTAs) and decision points.
- Avoid anonymous reviews, which are often perceived as artificial. Instead, use verified testimonials containing full names, job titles, geographical locations, or user-generated photos.
- Display verified average ratings prominently next to transaction buttons. For financial, B2B, or high-ticket lead generation platforms, display regulatory certifications (such as RBI compliance badges), industry awards, or security trust badges directly adjacent to form submission zones.
3. Frictionless, Multi-Step Conversational Forms
Forms represent major conversion bottlenecks. Long, complex forms with single-page layouts create high psychological resistance.
- Reducing required form fields from eleven to four can boost form completion rates by 120%.
- Transition standard forms into multi-step interactive experiences. Use clear visual progress indicators and tooltips for complex input fields.
- Enable autofill capabilities and real-time inline validation. Instead of displaying generic validation errors after submission, highlight valid inputs in real-time as the fields are completed.
4. Conversational Commerce Integration (The WhatsApp Factor)
In India, conversational channels are highly integrated with daily internet usage. Integrating direct WhatsApp triggers as secondary calls-to-action can improve lead capture.
For example, B2B platforms, real estate firms, and local service providers can implement a sticky “Chat with an Expert on WhatsApp” CTA alongside traditional web forms. This conversational channel captures leads who might otherwise hesitate to fill out a detailed inquiry form.
5. Dynamic Checkout and Payment Optimisation
Bottom-of-funnel drop-offs are often caused by rigid checkout designs that do not account for regional payment habits. To reduce cart abandonment, e-commerce checkouts should use localised, frictionless workflows:
- Default to UPI Payment Flows: Make the Unified Payments Interface (UPI) the default payment method. This allows users to complete transactions in a single tap through integrated apps like Google Pay, PhonePe, or Paytm, avoiding the need to manually input credit card details or navigate slow net-banking portals.
- Manage Cash on Delivery (COD) and Return to Origin (RTO) Risks: While COD remains a popular option for building trust with new online buyers, it introduces the operational risk of RTO due to customer cancellations or delivery failures. To balance conversions with risk, integrate tools like GoKwik or automated verification flows (such as automated WhatsApp confirmation sequences) to verify COD orders before shipping.
- Offer Simplified Guest Checkout: Do not force users to create an account before completing a transaction. Guest checkout pathways minimise steps and reduce barriers to entry.
Conversion Rate Optimisation: A/B Testing and Experimentation Guidelines
The CRO process doesn’t come with a universal checklist of items on which you can start one morning and start checking off through the day. It’s a series of complex, evolving, and highly specific measures that you develop and are unusually unique to your business context. What works for others doesn’t necessary do for you, and even when they do, it doesn’t mean you should care.
So, how should you decide what problems matter and which solutions to implement? That’s determined by the PIE framework.
The PIE Framework for Prioritisation
An effective experimentation program relies on prioritising opportunities based on their potential return on investment. The PIE framework is a standard methodology for scoring potential tests across three dimensions:
- Potential: How much can we improve this? You determine this by looking at drop-off rates, high bounce rates, or usability barriers in GA4 or heatmaps.
- Importance: How valuable is the traffic or expected revenue from this specific page or area? Optimising a checkout page or high-traffic landing page is a higher priority conversion goal over optimising an infrequently visited policy page.
- Ease: How simple is it to implement the change? A copy modification or headline change can be launched immediately, whereas a full technical checkout redesign requires significant engineering hours.
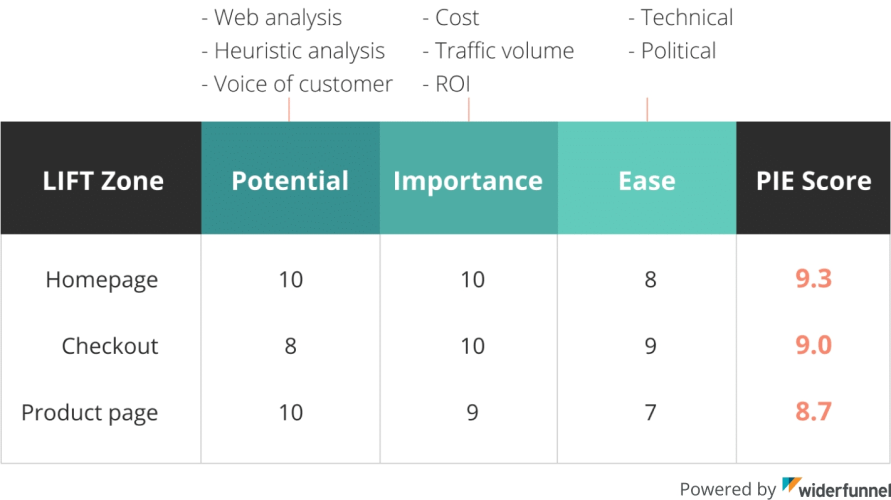
For each identified area of optimisation, the PIE framework assigns a score between 1-10 to each factor, i.e., P, I, and E. The average of these factors is calculated for each area, and then all the potential areas of optimisation are prioritised based on their PIE score.
The Continuous Optimisation Loop
That’s right! Conversion rate optimisation is a loop, and not a sprint. What’s working today, won’t necessarily work in a few months. And, new developments, such as platform algorithms, technology updates, or even changes in consumer behaviour, can make previously optimised systems ineffective. So, you need to set up a feedback loop to monitor, identify, and optimise conversion rates. Here’s what a typical conversion optimisation loop looks like:
📊 Gather Data Collect analytics, heatmaps, recordings and surveys. | → | 🔍 Identify Barriers Find friction points preventing conversions. |
| ↓ | ↓ | |
🚀 Implement Deploy successful changes site-wide. | 💡 Formulate Hypothesis Define a measurable improvement idea. | |
| ↑ | ↓ | |
📈 Analyze Results Measure uplift and statistical significance. | ← | 🧪 Design & Execute Test Run A/B or multivariate experiments. |
1. Gather Quantitative and Qualitative Data
Use web analytics tools like Google Analytics 4 alongside qualitative behavioural tools like Hotjar, Microsoft Clarity, or Crazy Egg. These tools generate click maps, scroll depth heatmaps, and session recordings to reveal exactly where users hesitate, exit, or lose interest.
2. Identify Opportunities and Funnel Leaks
Locate drop-off pages, forms with high exit rates, or navigation bottlenecks.
3. Formulate an Educated Hypothesis
Construct a clear testing hypothesis using a structured format: “By implementing [Variant X] on [Page Y], we expect to increase [Metric Z] because it addresses [User Pain Point W]”.
4. Design and Execute the Test
Build and test your variations. Ensure you test only one major element at a time (such as CTA button copy or headline layouts) to isolate variables and attribute performance accurately.
5. Analyse Experimental Results
Run tests until they reach a minimum of 95% statistical confidence to ensure changes are not the result of random variation. Tests should run for a minimum of two weeks and up to six weeks to account for daily and weekly variations in user behaviour.
6. Implement and Iterate
Make winning variations permanent, and use the data from failed tests to inform the next round of conversion optimisation.
Conversion Rate Optimisation: Technical SEO, Answer Engine Optimisation (AEO), and AI Overviews
The global search landscape is undergoing a major shift due to Google’s Search Generative Experience (SGE) and AI Overviews. These AI-generated summaries synthesise direct answers at the top of search results, allowing users to resolve their queries without clicking through to external websites.
The Zero-Click Impact on Organic Search Metrics
This evolution has accelerated the volume of zero-click searches, with studies indicating that approximately 60% of all searches now end without a click to an external website. This trend is reshaping traditional search metrics. Under this pattern, a website’s organic search impressions can remain flat or rise, while actual sessions and clicks decline. This mismatch occurs because Google places the AI Overview above the traditional organic search results. The user reads the generated AI answer and leaves, so the organic result registers an “impression” but loses the “click”.
The risk level and estimated CTR decline vary significantly depending on the intent of the search query:
| Search Intent | AI Overview Trigger Rate | Estimated Organic CTR Impact | Risk Level | ||
|---|---|---|---|---|---|
| 📚 Informational Queries | ➜ | 99.9% | ➜ | 58% – 61% CTR Drop | Critical Risk |
| ⚖️ Comparison Queries | ➜ | ~70% | ➜ | 40% – 55% CTR Drop | High Risk |
| 🛒 Commercial Queries | ➜ | ~19% | ➜ | 20% – 35% CTR Drop | Medium Risk |
| 📍 Transactional / Local Queries | ➜ | 7% – 8% | ➜ | 5% – 15% CTR Drop | Low Risk |
Conversion Rate Optimisation: Adapting to Answer Engine Optimisation (AEO)
While AI summaries reduce click-through rates (CTR) for traditional search listings, they drive highly targeted traffic to the specific sources they cite, often yielding a 35% increase in organic clicks for cited brands. Since 99.5% of URLs cited in AI Overviews already rank in the top ten traditional organic results, traditional search engine optimisation remains a prerequisite for visibility.
To capture these citations, digital marketers adopt Answer Engine Optimisation (AEO). This involves formatting content to be easily extracted by search bots and AI models:
- Direct Answer Formatting: Position a concise, direct answer of 20 to 40 words immediately following target question headers to allow for clean AI extraction.
- Snippet-Friendly Structures: Organise complex, data-heavy information into structured comparison tables, step-by-step numbered instructions, or bulleted lists.
- Structured Schema Markup: Apply correct schema markups (such as FAQPage and Product schemas) to help search engines parse your content structure.
- Long-Tail Conversational Targeting: Focus on longer, conversational queries (eight or more words), which are seven times more likely to trigger AI Overviews compared to short head terms.
Conversion Rate Optimisation: FAQs
What is a good website conversion rate benchmark in India?
A good website conversion rate in India sits between 2.1% and 3.5% across standard industries. High-performing D2C e-commerce brands achieve conversion rates of 4% to 6%, while B2B lead generation platforms typically target a baseline of 2.2%.
Why is mobile-first design essential for CRO programs in India?
Mobile-first design is essential because over 72.6% of all digital traffic in India originates from mobile devices. Optimising mobile touch layouts, form inputs, page speeds, and checkout steps yields a faster impact on conversion metrics than desktop optimisation.
How do UPI and Cash on Delivery (COD) payment configurations affect e-commerce conversions?
Configuring UPI as the default checkout method minimises input steps, reducing cart abandonment. Consumers prefer the quicker payment process offered by UPI in comparison to card or internet banking options, which require them to manually input a host of data, such as card details, login credentials, OTP, and so on. Further, offering Cash on Delivery (COD) builds trust with first-time buyers, but requires integration with automated confirmation tools to mitigate return-to-origin (RTO) risks.
What is the recommended duration and statistical significance required for A/B testing?
A/B tests must run for a minimum of two weeks and up to six weeks to account for weekly purchase patterns. To ensure validity, tests should reach a minimum of 95% statistical significance and capture at least 100 to 300 conversions per variation.
How does page speed impact website conversion rates?
Page speed is a primary driver of conversion; websites loading within 1 second achieve conversion rates 2.5x higher than websites loading in 5 seconds. Every additional second of delay reduces conversions by 7%.
How does form field reduction impact lead generation performance?
Reducing form fields from eleven to four can increase conversions by 120%. Using dynamic, multi-step conversational layouts alongside progressive profiling captures initial leads without creating immediate user friction.
What is the difference between CRO and SEO, and do I need both?
SEO focuses on ranking your website to drive organic traffic, while CRO optimises the on-site user experience to convert that traffic into active customers. Yes, you need both to build a highly efficient digital marketing funnel.
How do Google AI Overviews and zero-click search impact CRO?
AI Overviews satisfy informational search intent directly on results pages, reducing click-through rates. Consequently, CRO is essential to maximise the conversion value of the high-intent traffic that actually clicks through to your site.
Which CRO tools offer localised pricing plans or are best for Indian SMEs?
VWO is a premier, India-founded testing platform that offers dedicated domestic pricing structures. For SMEs starting out, a highly efficient free stack combines Google Analytics 4, Microsoft Clarity, and Google Search Console.
How does dynamic landing page personalisation improve acquisitions in India?
Personalised landing pages dynamically match a user’s location, source ad copy, or language preferences. Aligning localised pricing and targeted regional offerings with user location data can lift customer acquisitions by 25%.
How can Indian D2C e-commerce brands lower Return-to-Origin (RTO) logistics risks via CRO?
Brands can mitigate COD-related Return-to-Origin (RTO) risks by defaulting checkouts to UPI, implementing automated confirmation flows, verifying delivery addresses, and using background verification networks.
Final Thoughts
Navigating the conversion rate optimisation landscape in India is no longer about replicating generic, desktop-first Western strategies. With over 72% of domestic traffic originating from mobile devices and the market defined by distinctive payment flows like UPI and COD, high-growth Indian brands must adapt their funnels to match regional infrastructural and behavioural patterns.
To thrive in a highly competitive digital ecosystem characterised by rising customer acquisition costs and the steady progression toward zero-click AI search, companies must systematically identify funnel leaks, prioritise experimentation via the PIE framework, and establish E-E-A-T through validated domestic case studies. Local businesses can unlock compounding revenue gains from their existing traffic with effective CRO strategies. Ultimately, the brands that win the Indian digital space in 2026 are those that reduce cognitive friction, optimise performance, and build unshakeable local trust.
If you’d like to know how MagicDart can help your business unlock untapped revenues using conversion rate optimisation, call us at +91-79869-10830, email us at [email protected], or drop us a message here.

Leave a Reply